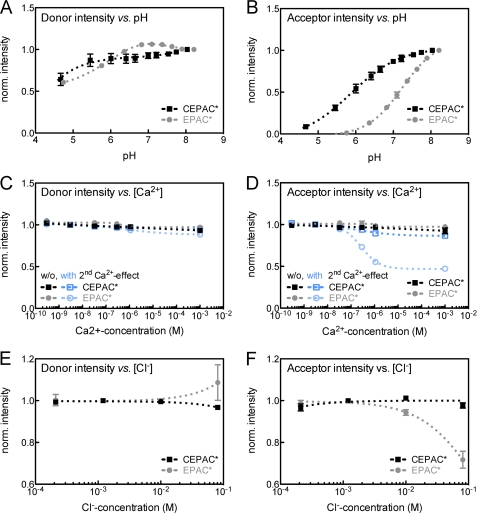
FIGURE 2.
H+, Ca2+, and Cl− concentration-dependent fluorescence intensity of FRET donor and acceptor of biosensor proteins CEPAC* and EPAC*. A and B, pH sensitivity; C and D, Ca2+ sensitivity with (blue) and without (black, gray) proton carried indirect calcium-effect; E and F, Cl− sensitivity. The first column (A, C, and E) shows the normalized fluorescence intensity of the donor unmixed component, and the second column (B, D, and F) shows the acceptor unmixed component. Donor and acceptor unmixed components are the result of a linear unmixing analysis of fluorescence spectra of the biosensor CEPAC* (black or dark blue) and EPAC* (gray or light blue). Dependences were fitted by using a Hill equation (dashed lines). Displayed values are mean and S.E. (error bars). Fitting results and numbers of experiments are presented in Table 1.

