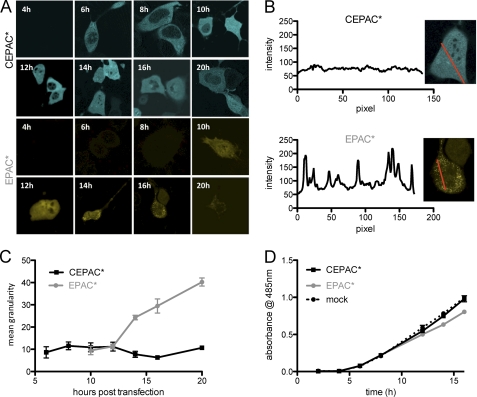
FIGURE 4.
Improved maturation kinetics and reduced tendency of aggregation. Cells transfected with CEPAC* or EPAC* and selected randomly at different time points after transfection were imaged for transgenic expression. A, CEPAC* expression can be detected as early as 6 h post-transfection, and expression levels remain high and uniform throughout the observed time period of 20 h. In contrast, EPAC*-transfected cells show the first signs of transgenic expression only after 10 h and remain uniform for only 3 h. After 14 h, the first cells expressing EPAC* start to show fluorescent aggregates, with aggregates increasing in number and size throughout the remaining observation period. B, illustration of an intensity line scan along a cell together with the intensity readout, used for determining the granularity. C, plot of granularity as a function of time, displaying mean values and S.E. (error bars) of 3 cells/time point. In cells transfected with CEPAC* (black), there is little change over time, whereas cells expressing EPAC* (gray) exhibit aggregation as early as 13 h post-transfection and at the end of the observation period display a significant increase in granularity compared with cells expressing CEPAC*. D, viability of cells expressing CEPAC* (continuous black line) or EPAC* (gray line) and of control cells (dashed black line) was detected over a time period of several h using the MTS cell proliferation assay. Shown are mean and S.E. results from the plate reader.

