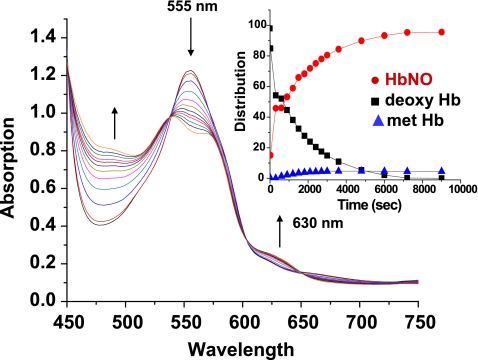
FIGURE 4.
Time-dependent changes in the visible absorption spectrum reflecting the nitrite reductase reaction for sol-gel-encapsulated Hbs trapped in the T state (0. 4 mm heme + 5 mm nitrite, 0.05 m Bistris OAc, pH 7.4, + 1 mm dithionite). The upward and downward pointing arrows indicate the increasing and decreasing absorbance, respectively. Inset, representative plot of the time-dependent changes in the population of different HbA species resulting from the nitrite reductase reaction of the sol-gel sample. (See “Experimental Procedures” for details). Red circle, NOHb; black square, deoxy; blue triangle, metHb.

