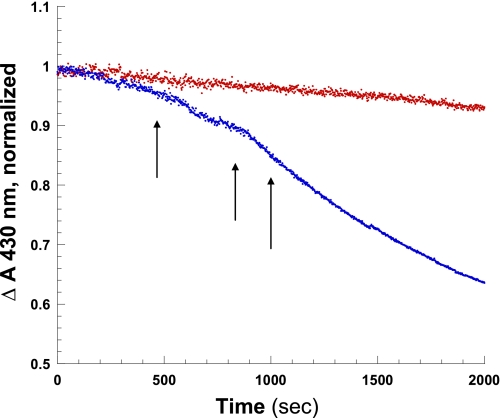
FIGURE 5.
Comparison of the initial rate for the nitrite reductase reaction for HbA in solution in the presence and absence of L35. DeoxyHbA + 1:1 nitrite ± L35. Red trace, 0.22 mm heme + L35 (1:1 heme); blue trace, 0.22 mm heme without L35. Solution conditions are as follows: 0.05 m BisTris, pH 7.4; arrows represent approximate time points when Band III peaks were generated (see Fig. 6).

