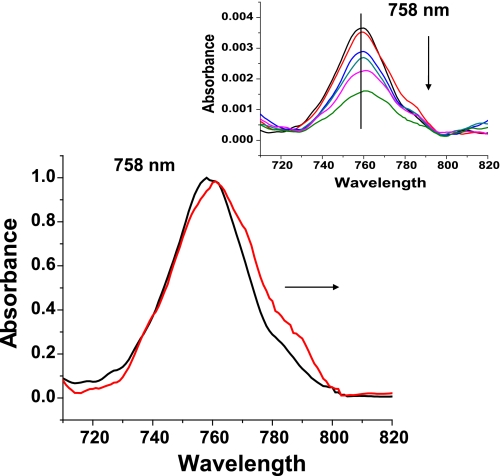
FIGURE 6.
Changes in the normalized absorption spectrum of Band III in the reaction of deoxyHbA with nitrite and at the appearance of the change in slope for this reaction. Black line, deoxy T state at time 0; red line, Band III at time point at the change in slope. Inset shows the time progression of Band III.

