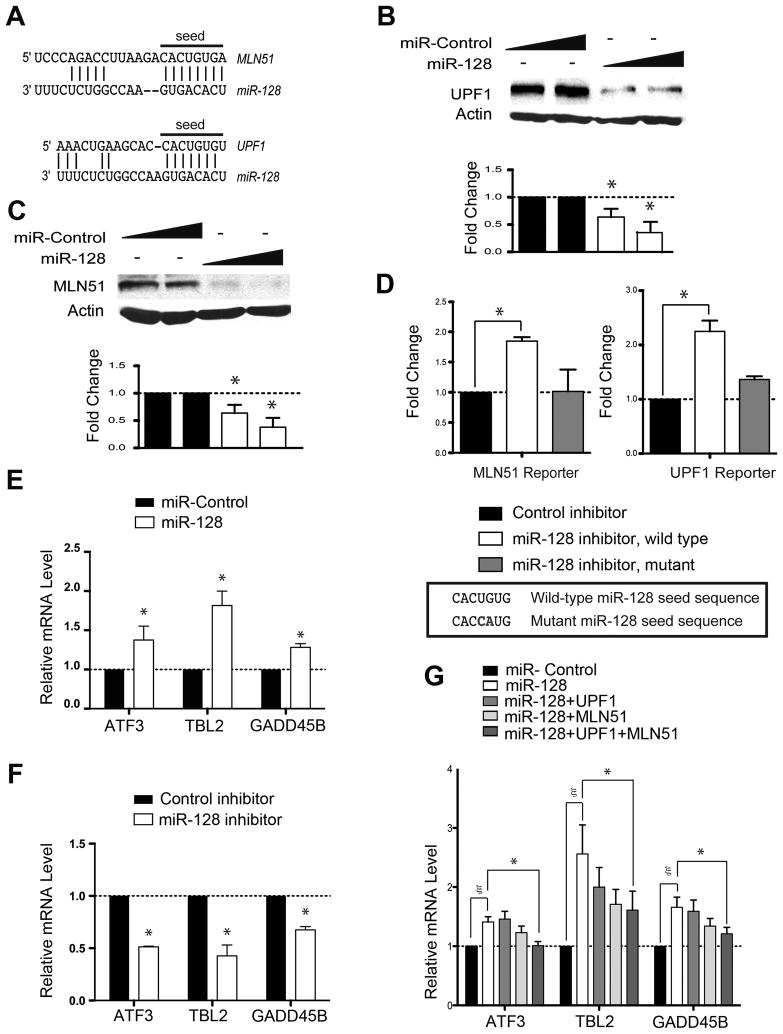
Figure 1. miR-128 Regulates NMD.
(A) Predicted base pairing of mature miR-128 seed sequences in the 3′ UTRs of MLN51 and UPF1 (http://www.targetscan.org).
(B, C) Western blot analysis of endogenous UPF1 and MLN51 protein levels in HEK293 cells 24 h after transfection with a mature miR-128 mimic or a random negative-control miRNA mimic (Ambion/ABI, Inc.). β-actin is the internal control. Bottom panels show the mean of three experiments; error bars represent standard deviation (SD).
(D) Luciferase expression in HeLa cells transfected for 24 h with firefly luciferase pmiR (Ambion/ABI, Inc.) reporters containing MLN51 or UPF1 3′ UTR sequences, including the putative miR-128 target sites shown in panel A. The mutants have the indicated 2-nt mutation in the target sequence. The cells were cotransfected with a miR-128-specific inhibitor or a negative-control inhibitor (Ambion/ABI, Inc.). A Renilla luciferase construct was co-transfected to control for transfection efficiency.
(E, F) Quantitative polymerase chain reaction (qPCR) analysis of HeLa cells transfected for 24 h with the indicated miRNA mimics (panel E) or LNA inhibitor (Exiqon, Inc; panel F). Shown are the results from three independent experiments, normalized to GAPDH mRNA levels.
(G) qPCR analysis of HEK293 cells transfected with the miR-128 or control mimic in combination with UPF1, MLN51, and/or empty expression plasmids. Quantification was conducted as in panel E.
For all panels, error bars indicate standard deviation. Asterisks and symbol (ζ) denote statistically significant differences; P < 0.05 (paired Student’s t-test).

