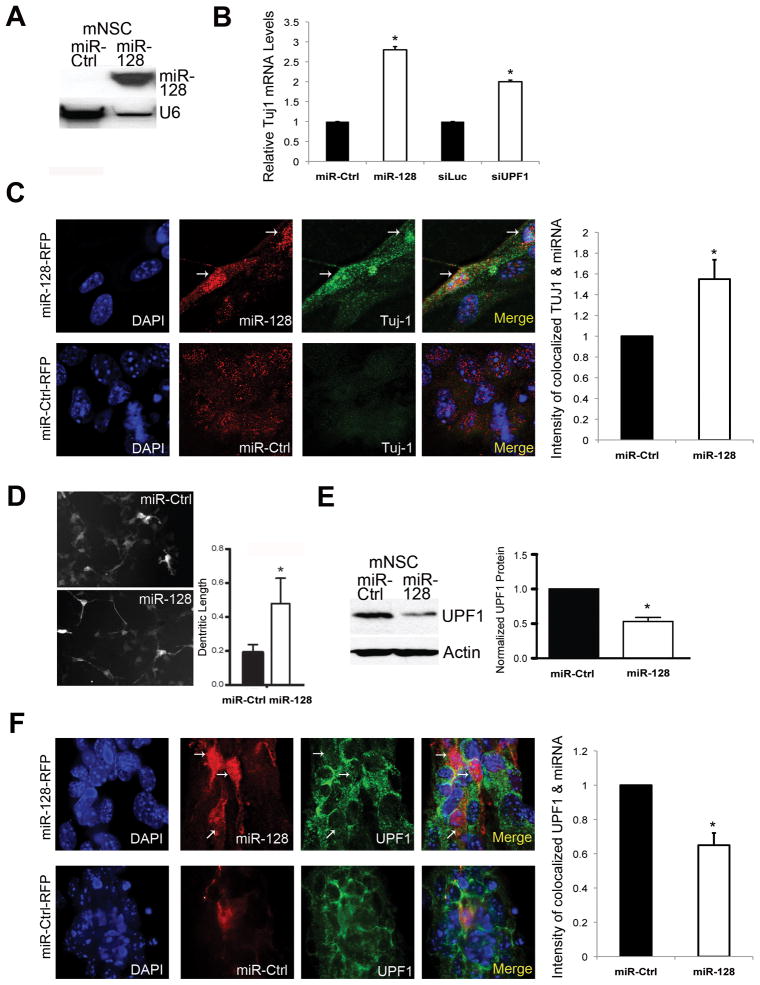
Figure 4. miR-128 Promotes a Neural Differentiation Phenotype and Inhibits UPF1 Expression in Neural Stem Cells.
(A) Northern blot analysis of mouse NSCs grown as neurospheres for 3 days under proliferating conditions and transfected with either the miR-128 mimic (miR-128) or control miRNA mimic (miR-Ctrl) (Ambion/ABI, Inc.). Shown is mature miR-128; U6 snRNA is the loading control.
(B) qPCR analysis of NSCs grown as described in panel A and transfected with miR-128 mimic, miR-Control, a siRNA specific for UPF1 (siUPF1), or luciferase siRNA (siLUC) as a negative control. Tuj-1 mRNA levels were normalized against L19 mRNA.
(C) Deconvolution microscopic analyses of TUJ-1 protein level in NSCs grown as described in panel A, infected with either miR-128-RFP- or miR-Ctrl-RFP-lentivirus, and cultured for 3 days. The images on the top left are of miR-128-RFP-lentivirus-infected cells; arrows mark the two cells expressing miR-128; the images on the bottom left are of miR-Ctrl-RFP-lentivirus-infected cells. DAPI staining shows location of all cell nuclei. The relative values shown on the right were determined using colocalization software and are the mean of three independent experiments. The intensity of colocalization of TUJ-1 and the miR-Ctrl is arbitrarily set to a value of 1.
(D) Mouse NSCs grown under adherent conditions were cotransfected with a GFP expression plasmid and either the miR-128 mimic or miR-Ctrl, followed by culture for 24 h. The graph shows the quantification of dendritic length in GFP-positive cells determined using ImageJ software.
(E) Left: Western blot analysis of endogenous UPF1 protein levels in mouse NSCs cultured and transfected as described in panel A. Right: quantification of 3 independent experiments using β-actin as a normalization control.
(F) Deconvolution microscopic analyses of UPF1 protein level in NSCs cultured, infected, and analyzed as described in panel C.
For all panels, error bars represent standard deviation and asterisks indicate statistically significant differences (P<0.05; paired Student’s t-test).

