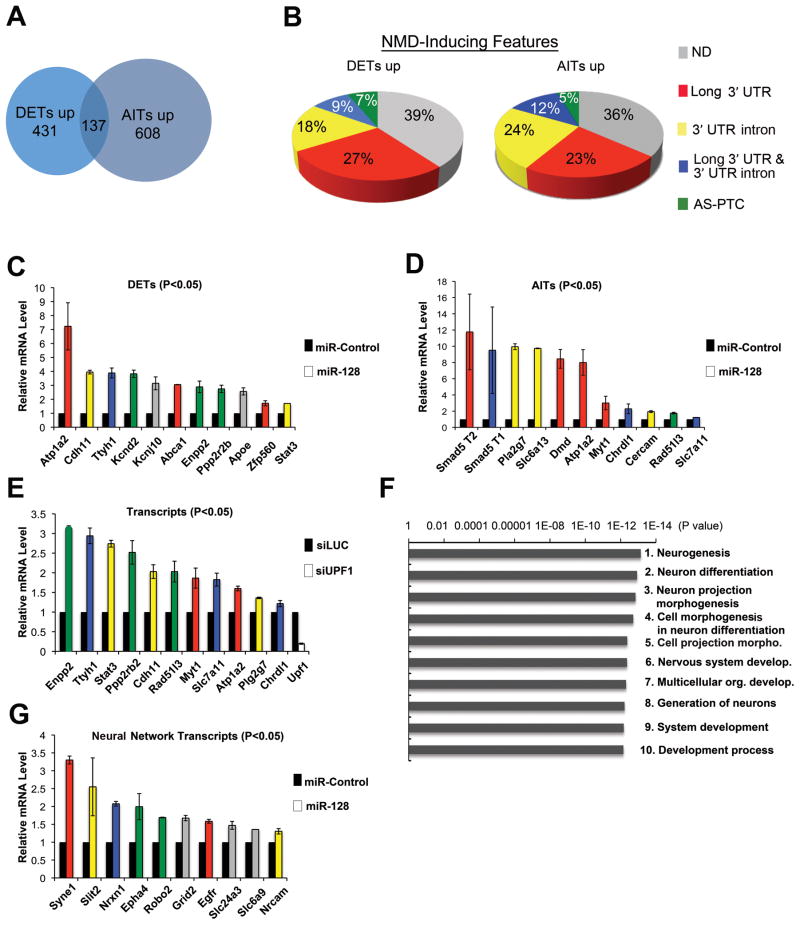
Figure 5. miR-128 Elicits Widespread Upregulation of Neural-Related Transcripts in Neural Stem Cells.
(A) VENN diagram of transcripts significantly upregulated (up) (p<0.05) in response to miR-128 in NSCs cultured and transfected as described in Figure 4A. The transcripts were identified using the Affymetrix mouse 1.0 ST exon array, which covers most of the known exons in 17,000 mouse protein-coding genes. Differentially expressed transcripts (DETs) and alternative isoform transcripts (AITs) are defined in the text.
(B) NMD-inducing features in the 100 most upregulated DETs and AITs, as determined using the SpliceMiner program: http://www.tigerteamconsulting.com/SpliceMiner/.
(C, D) Verification of DETs and AITs by qPCR analysis, performed on NSCs cultured and transfected as in panel A. mRNA levels were normalized to L19 RNA levels. The colors of the bars represent the known NMD-inducing feature of each transcript (see panel B).
(E) qPCR analysis of NSCs cultured as described in panel C and transfected with a siRNA specific for UPF1 (siUPF1) to inhibit NMD or a Luciferase siRNA (siLUC) as a negative control. Quantification and bar colors are as in panel C. We tested all transcripts in panels C and D for responsiveness to UPF1 knockdown; all those not shown in panel E were not statistically upregulated (p<0.05).
(F) Gene ontology (GO) processes most statistically overrepresented in DETs upregulated in response to forced miR-128 expression in NSCs, as identified using MetaCore™ software (GeneGo, San Diego, CA).
(G) Validation of selected transcripts in the neuronal GO categories “neurogenesis,” “neuron differentiation,” and “neuron projection morphogenesis.” qPCR analysis was performed on total cellular RNA from NSCs treated as described in panel C. Quantification and bar colors are as in panel C.
For all panels, experiments were performed in triplicate and error bars represent standard deviation. All transcripts shown in panels C, D, E, and G were significantly upregulated compared to controls (P<0.05; paired Student’s t-test).

