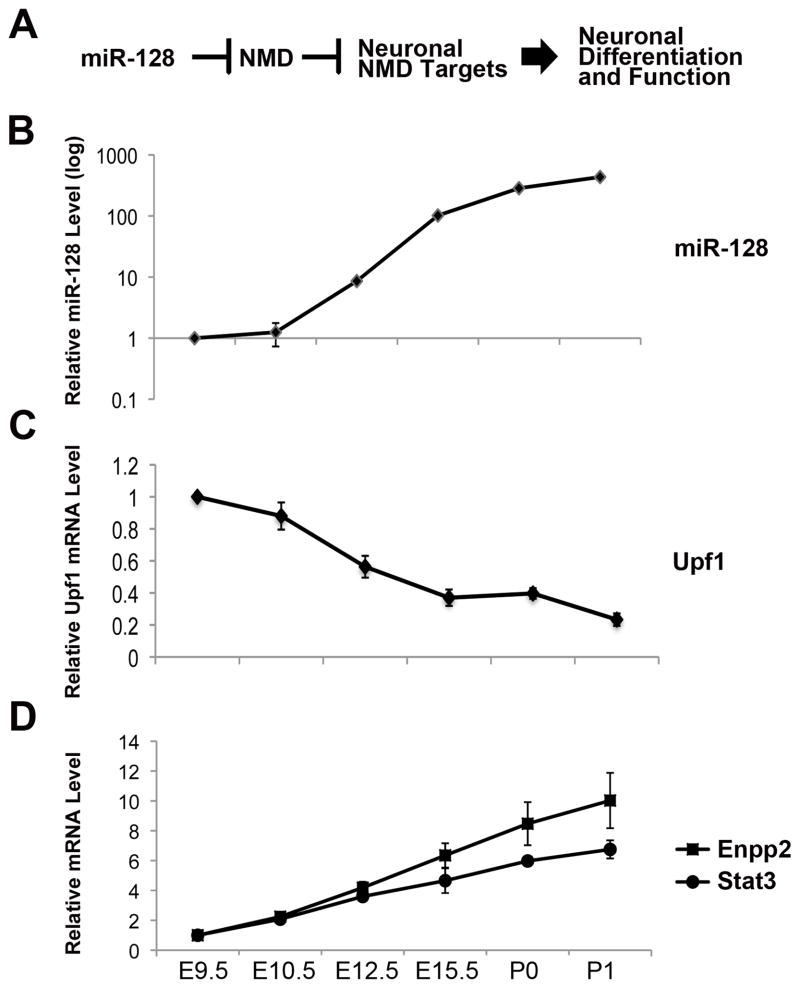
Figure 6. The Dramatic Upregulation of miR-128 During Brain Development is Accompanied by Upregulation of NMD Substrates.
(A) Model.
(B–D) qPCR analysis of pooled mouse brains from the indicated embryonic (E) and postnatal (P) time points. Mature miR-128 levels (B) were determined by Taqman-qPCR analysis and normalized against U6 snRNA levels. Upf1 mRNA (C) and NMD substrate (D) mRNA levels were determined using qPCR analysis and normalized against L19 mRNA levels. Error bars represent standard deviation.

