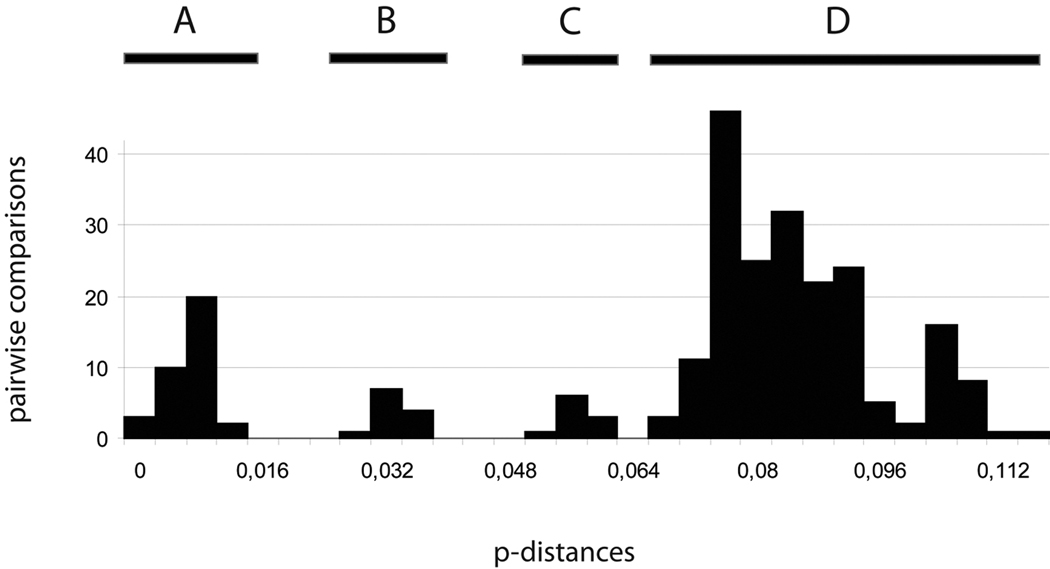
Fig. 2.
Pairwise COI genetic p-distances between all the specimens. Four modes are indicated. A: Distances between specimens within group 2, 5 (Philippines specimens only) and 6 (Vanuatu specimens only); B. Distances within group 3, 5 (Taiwan vs Philippines) and 6 (Solomon vs Vanuatu); C. Distances within group 6 (Madagascar vs others – see text for discussion); D. Distances between groups.

