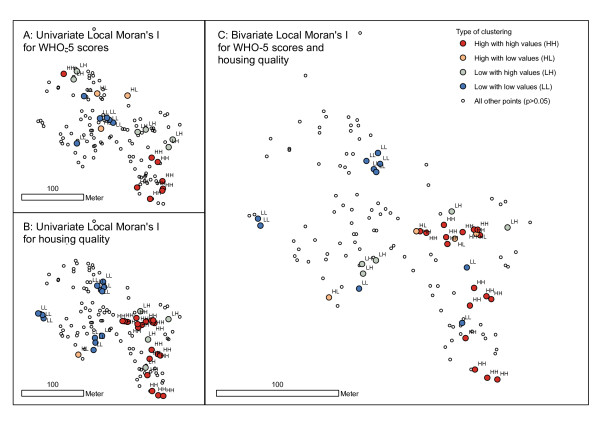
Figure 6.
Local cluster maps for mental health (WHO-5 scores) of males in the slum settlement Bishil/Sarag. Each dot on the map indicates a slum household (GPS point). The maps indicate significant (p < 0.05) spatial clusters of high (HH) or low (LL) WHO-5 scores (A), housing quality (B), or similar values of both WHO-5 scores and housing quality (C), respectively. High values surrounded by low values (HL) and vice versa (LH) indicate outliers. The three nearest neighbours of a household were used in the statistics.

