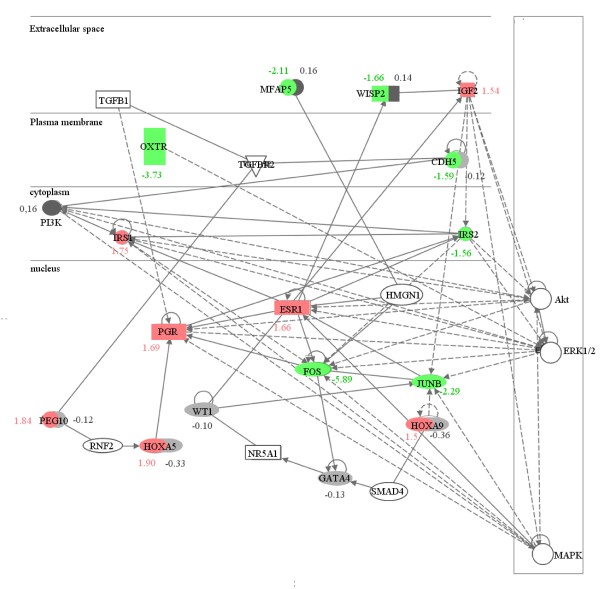
Figure 3.
Network of differentially expressed genes and genes containing differentially methylated CpG-sites. The fold change of regulation in the microarray analysis, (the p-value of the significance analysis) and the percentage of differential methylation are listed below the symbols. For the purposes of simplification, only selected known gene-to-gene interactions are shown. Continuous arrow lines show direct interactions between genes and broken arrow lines show indirect interactions.

