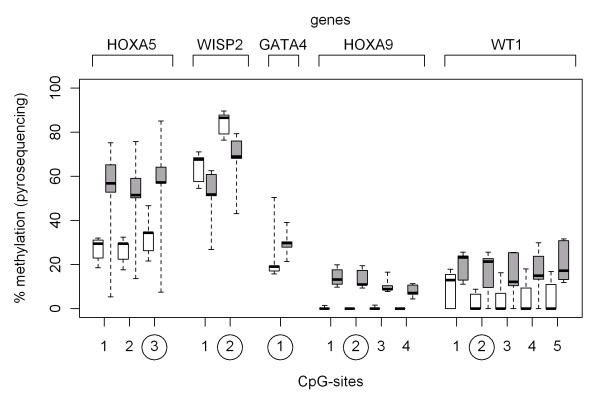
Figure 6.
Similar methylation in adjacent CpG sites within CpG islands. Degree of methylation within CpG islands: shown are box-and-whisker plots of the percentage of methylated cytosines for patients (white boxes) and contols (grey boxes). The circled CpG sites correspond to the specific sites detected in the array experiments.

