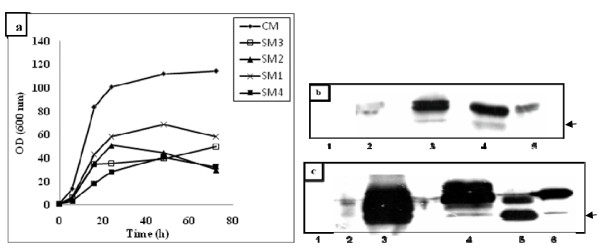
Figure 1.
Cell growth and hIFN α2b production profiles in different media culture. Time course of cell growth (a). Western blot analysis under reducing conditions using monoclonal antibody (b) and polyclonal antibody (c) directed towards hIFN α2b. Lane 1, SM3; lane 2, SM2; lane 3, CM; lane 4, SM4, lane 5, SM1 and lane 6 hIFN α2b standard. The arrows indicate protein degradation. Cultures were carried in duplicate in shake flasks at 28°C and 180 rpm. For clarity reasons error bars are not shown.

