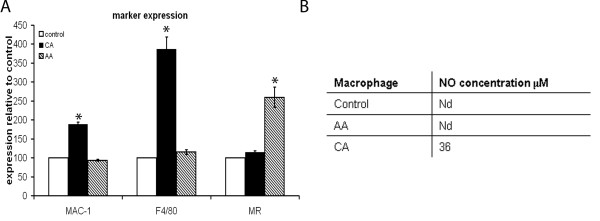
Figure 1.
Analysis of macrophage phenotype. A) Using FACS analysis the expression of markers for the differently activated phenotype was determined. CA macrophages expressed significantly more MAC-1 and F4/80 compared to AA and control macrophages. MR expression was significantly higher on AA macrophages compared to control and CA macrophages. B) NO production was undetectable in both control and AA macrophages. CA macrophages did produce NO.

