Figure 5.

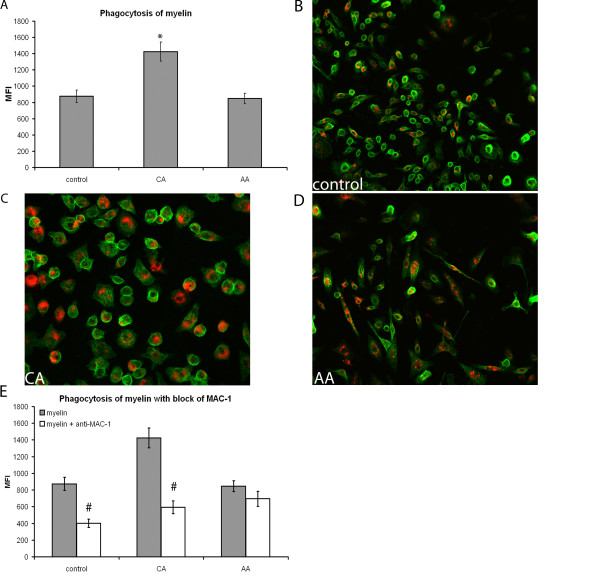
Phagocytosis of myelin by differently activated macrophages. Phagocytosis of fluorescently labeled myelin by activated bone marrow derived macrophages and expression of CR3 was determined using flow cytometry. MFI was measured and data are the mean of 4 separate experiments (n = 4) ± SEM. *= p < 0.05 and #= p < 0.05. A) CA macrophages phagocytosed significantly more myelin compared to control and AA macrophages. B-D) Visualization of myelin internalization by phagocytosis, red: DiI labeled myelin; green: Mac-1 on macrophage membrane. Representative images, taken on a confocal microscope, are shown. Red myelin is seen inside the green labeled membrane of the differently activated macrophages. All macrophage phenotypes appear to have taken up myelin. A 20 times magnification was used. E) Using anti-MAC-1 antibody, phagocytosis of myelin by CA and control macrophages could be blocked significantly, as indicated by #. Anti-MAC-1 antibody did not affect myelin phagocytosis by AA macrophages.
