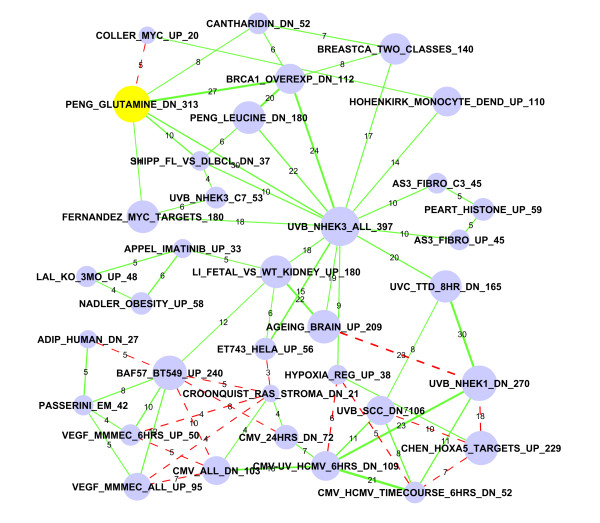
Figure 5.
Sub-network #8: Glutamine starvation and c-Myc genes. The glutamine starvation down-regulated gene set is highlighted in yellow, which is connected to sets of MYC target genes. Nodes represent gene sets and edges represent significant overlaps. The size of the node indicates the number of genes in the gene set, which is also numerically labelled by the number at the end of each gene set name. The thickness of the edges is proportional to significance (-log10(FDR)). The labels of edges indicate the number of overlapping genes. The labels of edges indicate the number of overlapping genes. Red dashed edges represent repressive connections between "X" upregulated genes and "Y" downregulated genes. The "Peng_Glutamine_Dn" list significantly overlaps with almost all MYC related gene sets.

