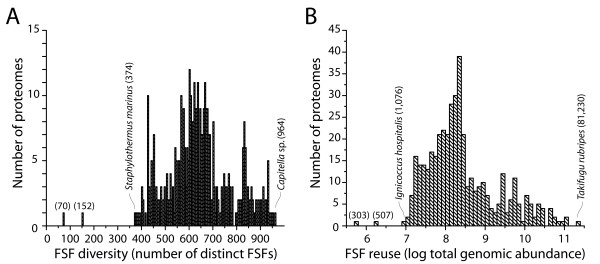
Figure 5.
Diversity and reuse of FSFs in proteomes. A. Frequency distribution plot describing the number of proteomes for increasing numbers of distinct FSFs in individual proteomes, in bins of 5. The FSF numbers of the min_set, max_set, and the smallest and the largest proteomes are given in parentheses. B. Frequency distribution plot describing the number of proteomes for increasing levels of FSFs reuse in individual proteomes. Reuse scales multiple occurrences of FSFs in proteomes and is logarithmically normalized.

