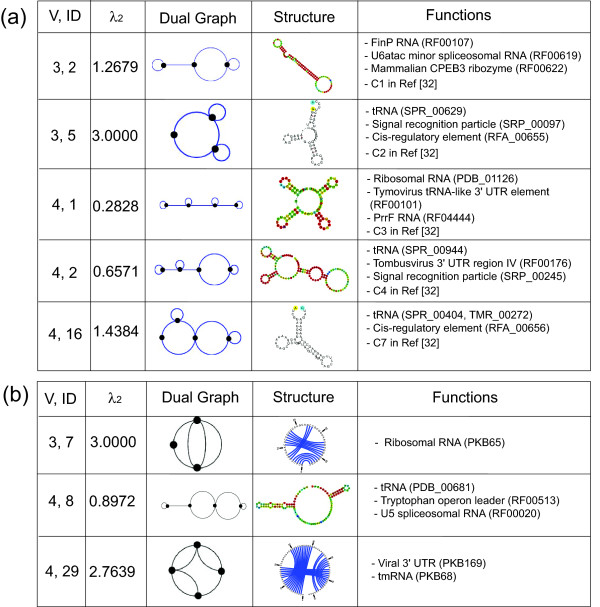
Figure 5.
Examples of newly confirmed RNA dual graphs from RNA-like (a) or non-RNA-like (b) graphs classified in the 2004 RAG database. The vertex number, ID (first column) and the second smallest eigenvalue (second column) are shown for each RNA tree graph (third column). RNA secondary structures and their functions are shown in the fourth and fifth columns. In (a), the five identified RNAs that correspond to our candidate topologies with 3 and 4 vertices in 2004 using PAM [32] are shown (C1, C2, C3, C4 and C7).

