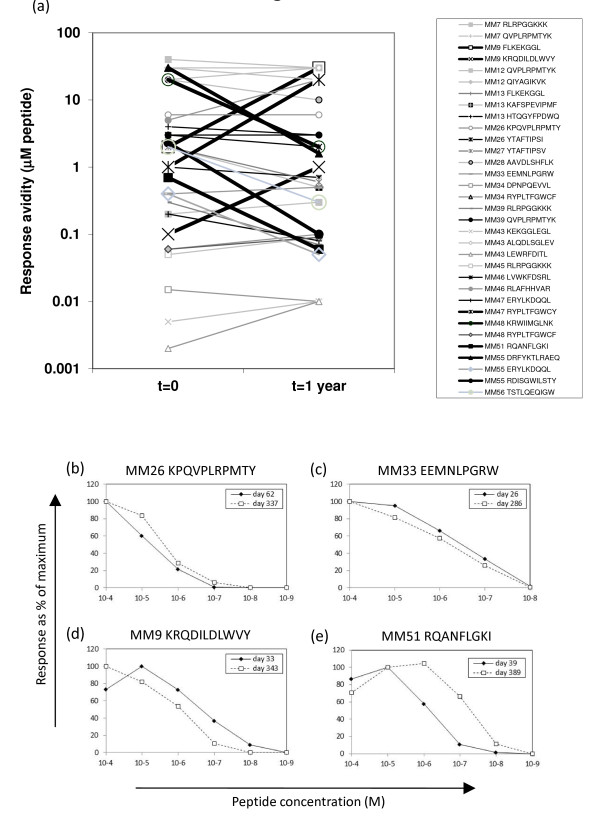
Figure 3.
Comparison of the functional avidity of HIV-specific T cell responses at the earliest sampling time-point tested and ~1 year following symptomatic presentation. For each of 33 HIV-specific T cell responses, patient PBMC from the earliest sampling time-point available (t = 0), and from t = 1 year following symptomatic presentation with HIV infection were stimulated with log-fold titrations of index sequence peptide (between 10-4M and 10-10M) in an IFNγ ELISPOT assay. The functional avidity of the response was determined (the peptide concentration stimulating half the maximal IFNγ response in the assay). The graph in (a) shows, for each individual response, the functional avidity at the two time-points. Responses changing in avidity by ≥ 1 log between the two time-points are indicated with bold lines. Examples of data for four representative responses are shown in panels (b-e).

