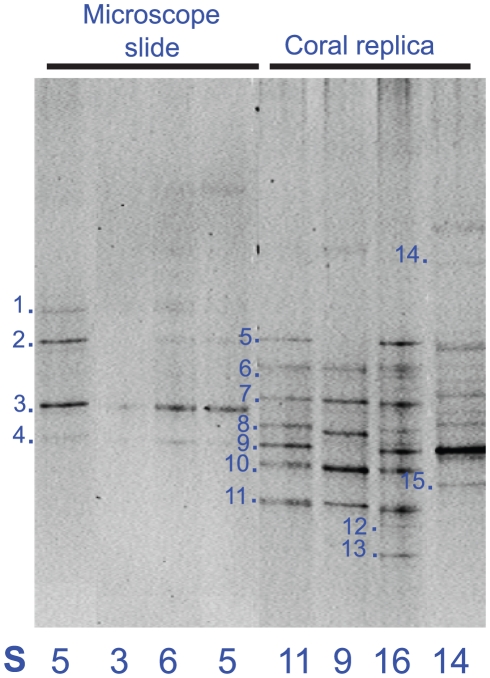
Figure 1. Composite DGGE image showing replicates collected at 4 h of biofilm development on microscopic slides and replica coral nubbins with dominant bands sequenced ( Table 2 ), gel-to-gel comparisons were standardised using internally run marker lanes and analysed using BioNumerics software.
S = number of bands visible in DGGE using BioNumerics representing relative diversity.

