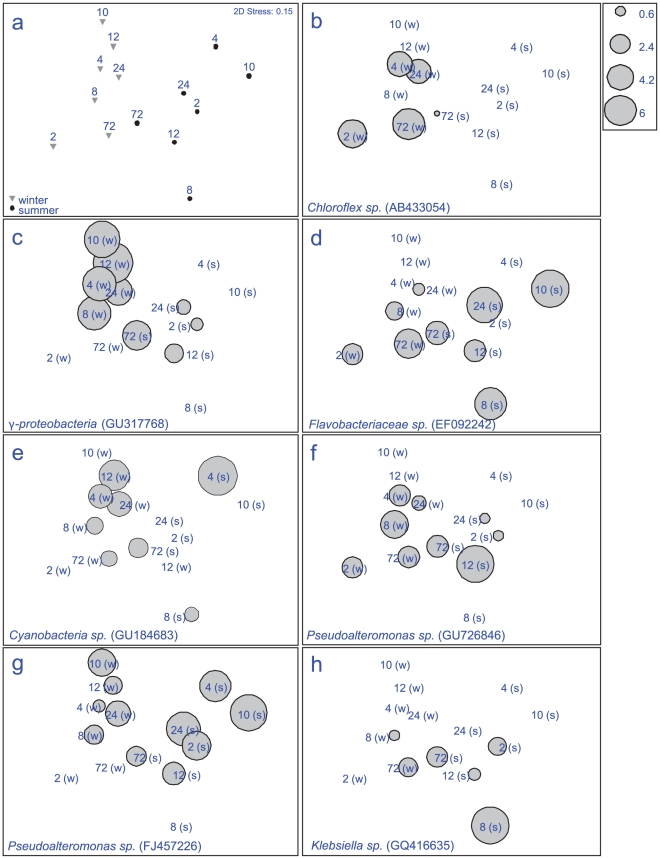
Figure 2. Multidimensional scaling plot (MDS), showing seasonal changes in bacterial communities (16S rRNA gene fingerprints), developing on the biofilm of the replica coral nubbins enriched with agar; (a) average of n = 3 replicates for different time scales of biofilm development for both seasons; summer (s) (March 2009) and winter (w) (August 2008), (b–h) representatives of the sequenced ribotypes responsible for the greatest differences between seasons, Latin name and gen bank sequence ID included.
Size of bubble depicts intensity of band/ribotype on DGGE within individual samples.

