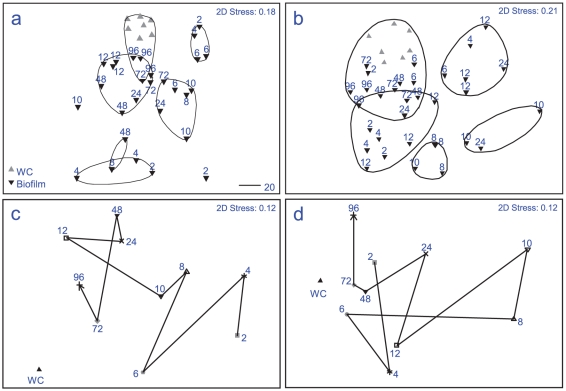
Figure 3. Multidimensional scaling plot (MDS), showing hourly changes in bacterial communities (16S rRNA gene fingerprints), developing on the biofilm of the replica coral nubbins enriched with agar; (a) winter samples (August 2008); (b) summer samples (March 2009).
Averages of time periods showing trajectory of similarity between time points, (c) winter and (d) summer. WC = water column.

