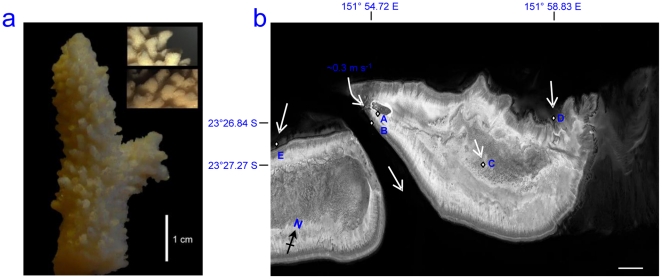
Figure 8. Example of novel methodology utilised in this study and site location; a) Photograph of replica coral nubbins used in experiment with close up sections of the mould (insets), b) Site map showing, Heron Island GBR, Australia (23°27′S, 151°55′E), location of main study site (A) the Reef Flat and those used in spatial sampling; (B) Coral Gardens 23°26.839/151°54.717 (C) Lagoon 23°27.272/151°57.921 (D) 3rd/4th Point 23°26.146/151°58.833 (E) Wistari 23°29.081/151°54.015.
Arrows depict water current direction at time of sampling with direction and speed noted. Samples were taken on calm days, one hour before high tide, with wave speed WS<0.5 m/s and wave heights HS<0.5 m. Scale bar = 1 km.

