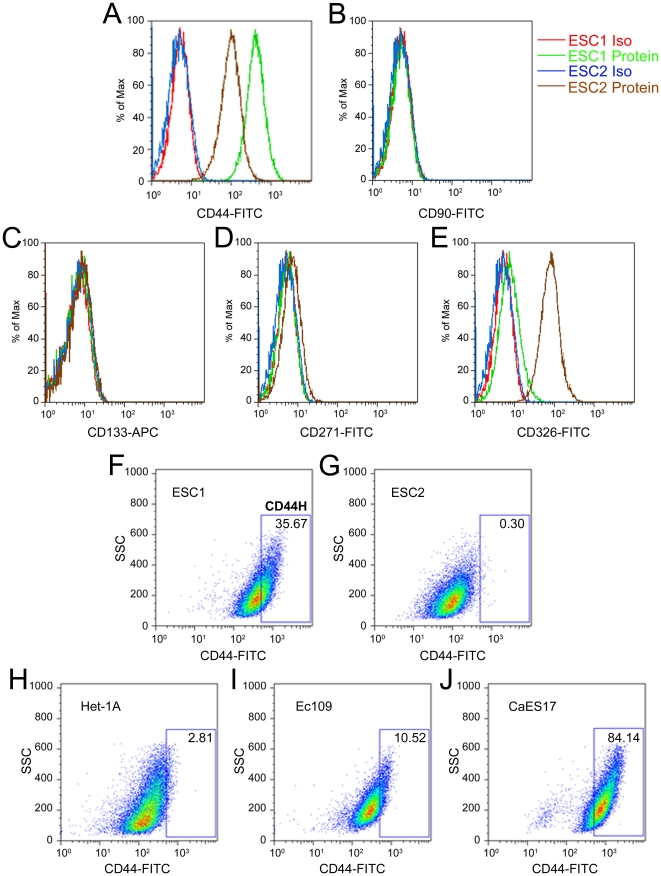
Figure 2. Expression of cell surface protein on ESCC cells.
(A–E) measurement of the expression of CD44 (A), CD90 (B), CD133 (C), CD271 (D) and CD326 (E) in ESC1 and ESC2 cells by flow cytometry analysis. (F–J) Representative flow cytometry results examining the expression of CD44 in ESC1 (F), ESC2 (G), Het-1A (H), Ec109 (I) and CaES17 (J) cells. Using the comparative level of expression of CD44 in ESC1 versus Het-1A, we defined CD44 highly expressed subpopulation cells within the ESC1 line as CD44H (High) cells, and the remainder of the cell population as CD44L (Low) (F). ESC1 Iso (red line): ESC1 cells stained with isotype control antibody; ESC1 Protein (green line): ESC1 cells stained with candidate surface protein antibody; ESC2 Iso (blue line): ESC2 cells stained with isotype control antibody; ESC2 Protein (brown line): ESC2 cells stained with candidate surface protein antibody; FITC: fluorescein isothiocyanate; APC: allophycocyanin; SSC: side scatter.

