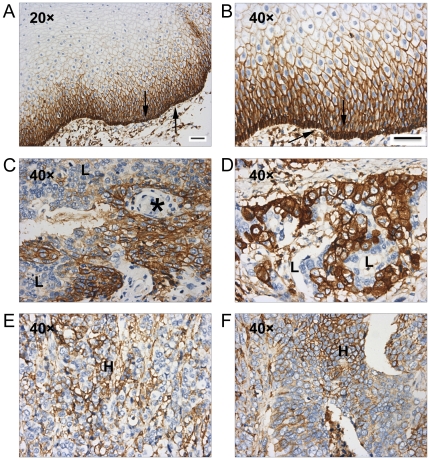
Figure 3. Expression of CD44 in ESCC specimens.
(A) Representative IHC analyses of CD44 in normal esophageal tissues. (B) Magnification of (A) demonstrated that the expression of CD44 was in the basal layer (indicated by arrow). (C–F) Representative IHC analyses of CD44 in ESCC tissues. (C–D) showed specimens with strong expression of CD44 and (E–F) showed cases with weak expression of CD44. * indicated keratin pearl, a structure which represents terminal differentiation of the cancer cells; Letter “L”, cells exhibiting lower expression level of CD44 in (C–D); letter “H”, cells exhibiting higher expression of CD44 in (E–F). Scale bar: 50 micrometer.

