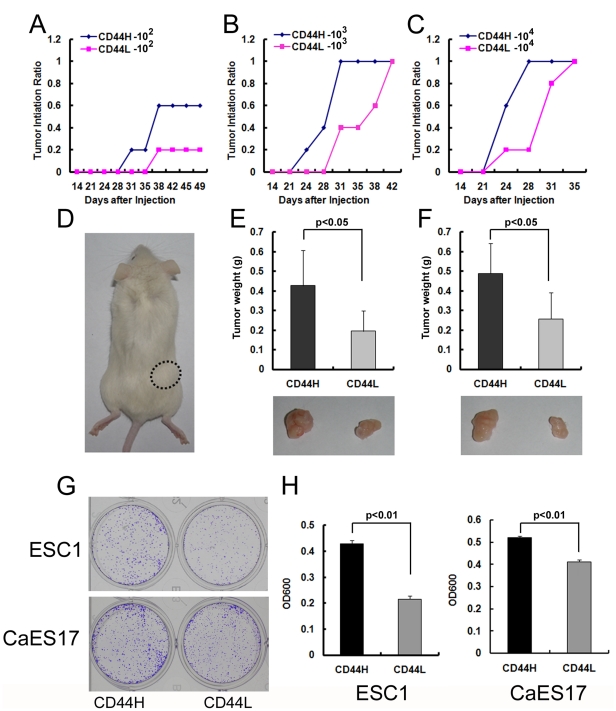
Figure 5. CD44H subpopulation was more tumorigenic than CD44L cells.
(A–C) Tumorigenicity of 1×10² (A), 1×10³ (B) or 1×10⁴ (C) sorted CD44H and CD44L ESC1 cells in NOD/SCID mice. (D) Representative NOD/SCID mice with subcutaneous tumors from either CD44H (circle dash line) or CD44L (no tumor formed) ESC1 cells at the dosage of 1×10². (E–F) Average tumor weight of CD44H tumors and CD44L tumors at the dosage of either 1×10³ (E upper panel) or 1×10⁴ (F upper panel). Representative subcutaneous tumors derived from CD44H or CD44L ESC1 cells at the dosage of either 1×10³ (E lower panel) or 1×10⁴ (F lower panel). Data are generated from 5 mice in each group. (G) Representative photographs of the plates containing colonies derived from either 2000 CD44H or CD44L ESC1 or CaES17 cells. (H) Quantification of (G) by Crystal Violet staining. Colony formation experiments were performed in triplicate (mean ± SD).

