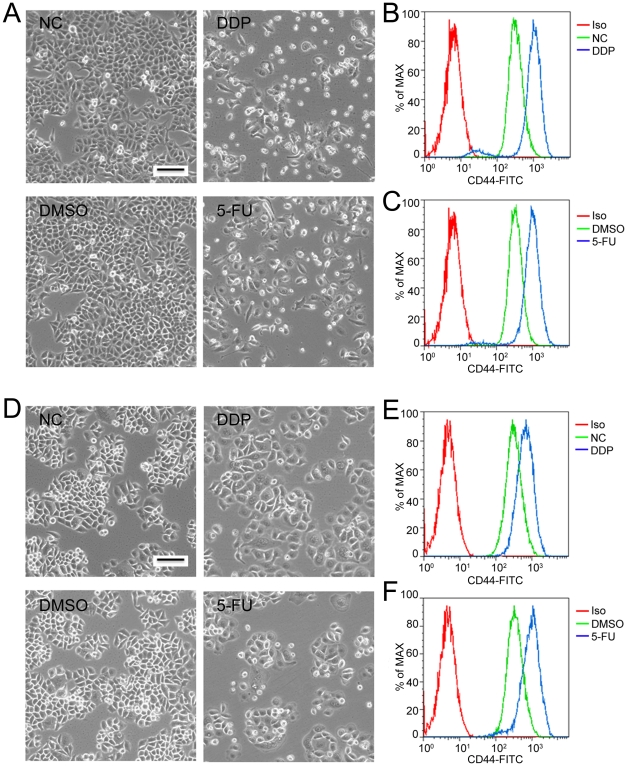
Figure 6. Chemotherapeutic drugs induced cell death in ESC1 and Ec109 cells and enriched for a CD44H population of cells.
(A) Morphology of ESC1 cells treated with either 12.5 µg/ml DDP (cis-Diammineplatinum(II) dichloride, right upper panel) or 1.25 µg/ml 5-FU (5-Fluorouracil, right lower panel) for 2 days. (B–C) Representative flow cytometry analyses of CD44 expression in ESC1 cells after either DDP (B) or 5-FU (C) treatment. (D) Morphology of Ec109 cells treated with either 50 µg/ml DDP (right upper panel) or 2 µg/ml 5-FU (right lower panel) for 2 days. (E–F) Representative flow cytometry analyses of CD44 expression in Ec109 cells after either DDP (E) or 5-FU (F) treatment. Iso: isotype control; NC: blank control; DMSO: DMSO diluents treated cells; DDP: DDP treated cells; 5-FU: 5-FU treated cells; Scale bar: 50 micrometer.

