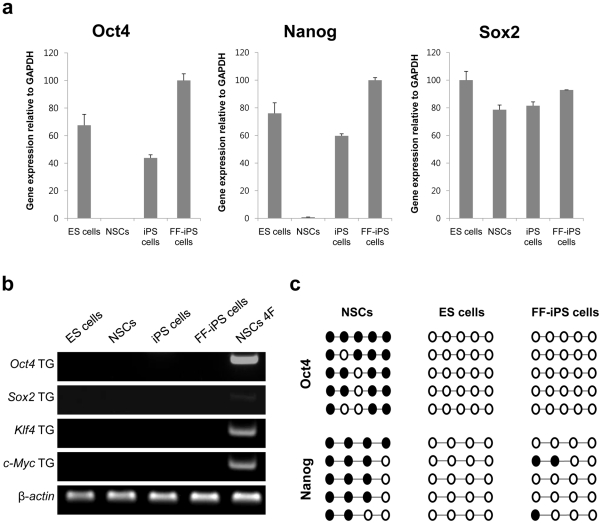
Figure 2. Pluripotency Marker Expression Levels and Methylation Pattern in FF-iPS cells.
(a) Expression levels of endogenous factors (Oct4, Sox2, Nanog) quantified by real-time-PCR. (b) RT-PCR analysis for retroviral transgenes. (c) Bisulfite genomic sequencing of the promoter regions of Oct4 and Nanog.

