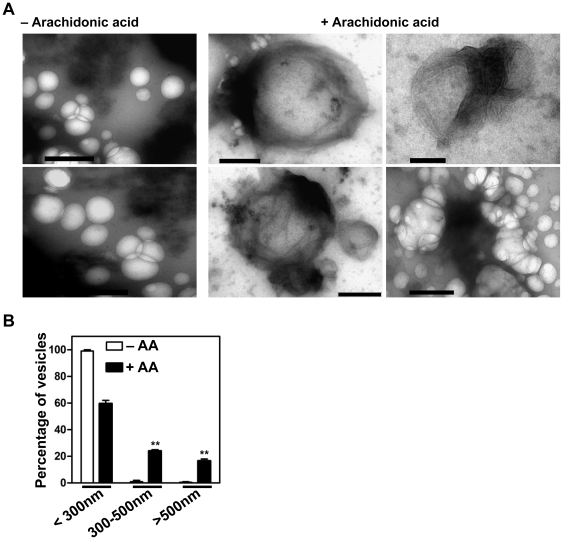
Figure 2. Transmission electron microscopy analysis of products from in vitro vesicle fusion assays.
(A) EGFR-DsRed and EYFP-Rab5a vesicles were incubated with immunopurified TIP30 complex in the fusion buffer with (right panel) or without (left panel) 100 nmol of arachidonic acid. Resulting vesicles were stained with uranyl acetate and examined using TEM. Scale bars, 500 nm. (B) The graphs show the percentages of vesicles with different diameters. At least 6 images from two independent experiments were counted. Data represent means ± SEM. n = 150; **P<0.01, t test.

