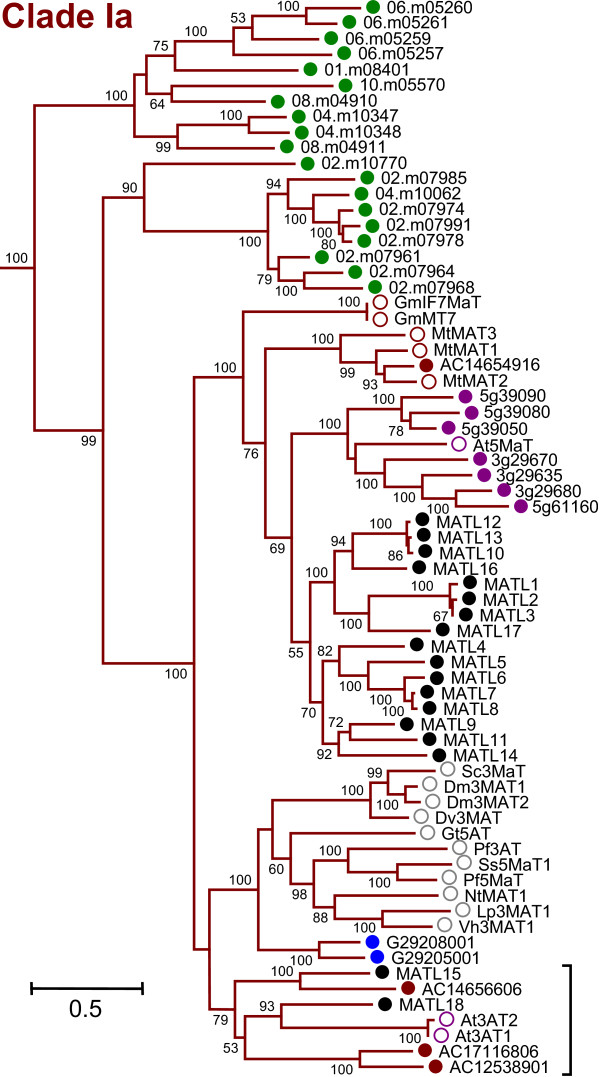
Figure 2.
Phylogenetic Relationship of Clade Ia Members. Expanded view of all Clade Ia sequences from Figure 1A. Bracket indicates region lacking taxon-specific clustering. Filled circles represent putative BAHD acyltransferases, while open circles represent characterized BAHD proteins. Colors correspond to taxa as listed in Figure 1, with gray circles indicating sequences from plants within the Asterids. Populus sequence names are provided in Additional File 1. Loci from the other four genomes have been truncated to accommodate text input limitations (e.g., 1g03495 for At1g03495 of Arabidopsis, AC1253891 for AC125389_1 of Medicago, 01.m08401 for 12001.m08401 of Oryza, G29205001 for GSVIVP00029205001 of Vitis). GenBank accession numbers and full names for previously characterized proteins are provided in Additional File 10.

