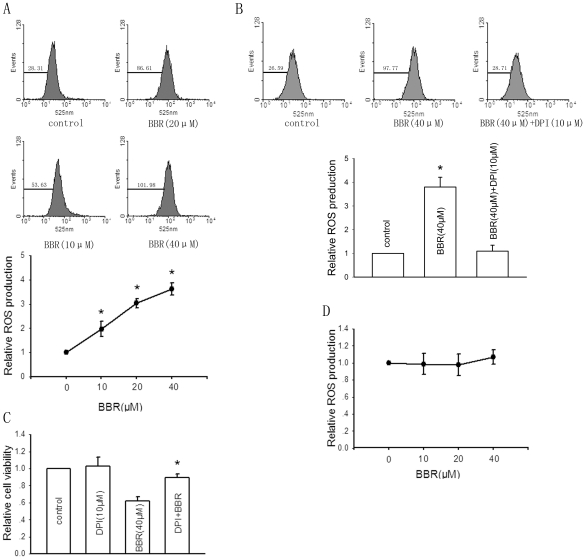
Figure 2. Berberine (BBR) induces cytotoxicity in HepG2 cells through upregulation of ROS production.
A, Cells were treated with indicated concentrations of berberine for 24 hours. Intracellular ROS level was represented by the intensity of DCF fluorescence determined by flow cytometric analysis (left panel). The right graph represented the mean±SD of intensity of DCF fluorescence from five independent experiments. *Significantly different from DMSO control, P<0.05. B, The effect of pretreatment with 10 µM of DPI,a scavenger of ROS, on berberine-enhanced ROS production. Bars are mean±SD from four independent experiments. *Significantly different from DMSO control, P<0.05. C, The effect of pretreatment with 10 µM of DPI on berberine-induced cytotoxicity in HepG2 cells. Bars are mean±SD from five independent experiments. *Significantly different from only berberine (40 µM) treatment group, P<0.05. D, The effect of berberine of indicated concentrations on ROS production in Chang liver cells.

