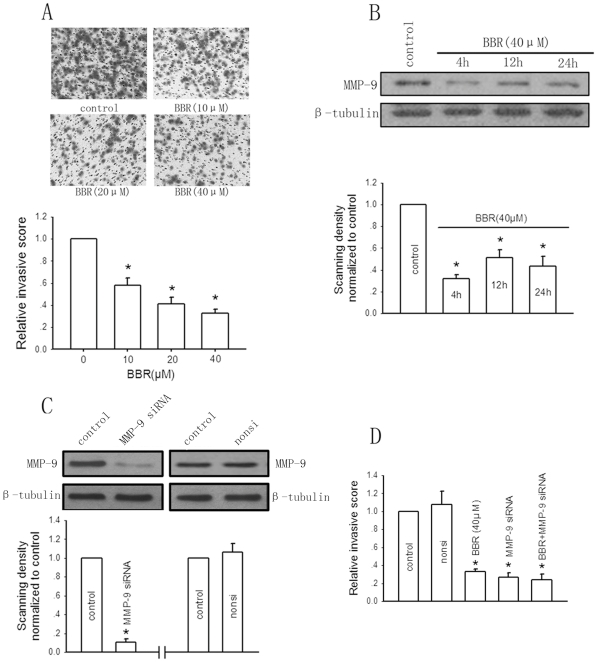
Figure 3. The MMP-9 expression-dependent anti-invasive effect of berberine (BBR) on HepG2 cells.
A, The effect of berberine (10–40 µM) on HepG2 cell invasion was determined by invasion assay after 24-hour incubation. Bars are mean±SD from six independent experiments. *Significantly different from DMSO control, P<0.05. B, The effect of berberine at indicated times of exposure on MMP-9 expression. The protein level of MMP-9 was determined using the specific antibody and western blotting. Bar graphs are derived from densitometric scanning of the blots. Bars are mean±SD from four independent experiments. *Significantly different from DMSO control, P<0.05. C, Effects of MMP-9 siRNA and nonsilencing siRNA (nonsi) on MMP-9 expression determined by western blotting. Bar graphs are derived from densitometric scanning of the blots. Bars are mean±SD from three independent experiments. *Significantly different from DMSO control, P<0.05. D, The effect of MMP-9 siRNA and berberine on cell invasion. Bars are mean±SD from five-senven independent experiments. *Significantly different from DMSO control, P<0.05.

