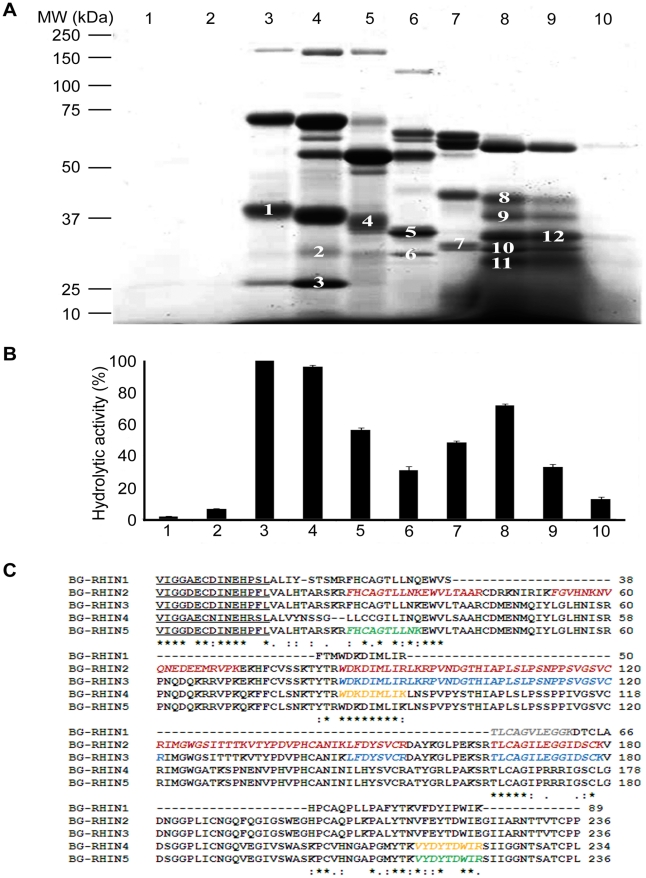
Figure 1. Identification of rhinocerases 1–5 in the venom of B. g. rhinoceros.
A. 1 mg of venom was mixed with non-reducing rotofor buffer containing ampholytes with pI 3–10 and separated under non-denaturing conditions using a micro rotofor. In total 10 fractions (indicated by the numbers at the top of the gel) were collected. 10 µl of each fraction were run in SDS-PAGE (10%) and stained with SimplyBlue™SafeStain. The numbers mentioned on the gel bands represent the bands which were excised and used for mass spectrometry. B. 20 µl of each rotofor fraction were used to measure serine protease activity using Arg-AMC fluorescent substrate. The data represent the mean±S.D. (n = 3). The hydrolytic activity measured for fraction 3 was taken as 100%. C. The sequences of rhinocerases 2–5 were aligned with the partial sequence of rhinocerase 1 obtained previously. Gel bands 1, 7, 8, 11 and 12 (Fig. 1A) were analysed by mass spectrometry and the corresponding peptide sequences are shown in different colours (grey: band 1; red: band 7; yellow: band 8; blue: band 11; green: band 12) in italics on rhinocerase 1, 2, 4, 3 and 5 respectively. The N-terminal sequences of serine proteases in the venom of B. g. rhinoceros identified by proteomic analysis previously are underlined. The symbols ⋆, : and . indicate conserved residues, biochemically related residues and biochemically less related residues respectively.

