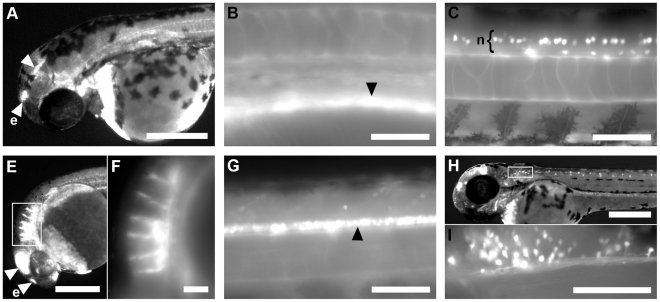
Figure 3. Expression unique to individual stable transgenic lines.
(a) Line 192A at 48 hpf. GFP expression is observed in regions of the midbrain (arrowhead) and in the epiphysis (e). Line 512B at 24 hpf (b) and 48 hpf (c). Expression is seen in the dorsal aorta and in ventral neurons (n) of the spinal cord. Line 812A at 24 hpf (d–e) and at 48 hpf (f). Expression can be seen in the epiphysis, the midbrain and in a banding pattern in rhombomeres (boxed). White box indicates the area enlarged in (e). Later expression is observed in the floor plate of the spinal cord (f). (g–h) Line 812C at 48 hpf. Expression is seen in the epiphysis and the midbrain. GFP is also noted in a specific subpopulation of spinal cord neurons and neurons posterior of the otic vesicle in the hindbrain (boxed). White box indicates the area enlarged in (h). Lateral views of embryos, anterior is left and dorsal is up. Scale bars in a, d, g = 250 µm, in b, c, e, f, h = 50 µm.

