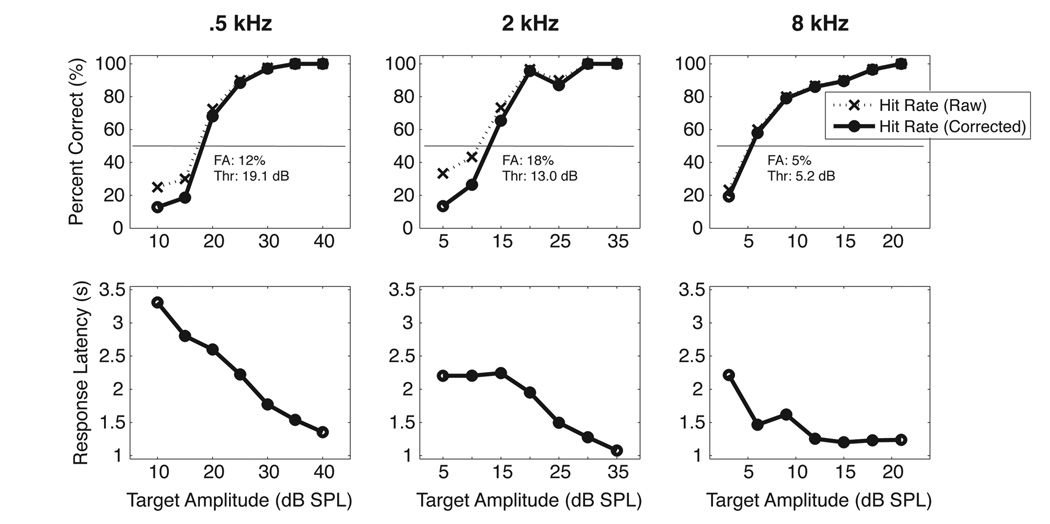
Figure 1.
Representative psychometric functions and response latencies from one subject (Marmoset 4) at three different frequencies. Upper panels show changes in hit rate as a function of stimulus amplitude. Dotted lines show raw hit rates while solid lines show hit rates after a correction for false alarm rate has been applied (see text for a description). Lower panels show concomitant changes in the animal’s latency to lick.

