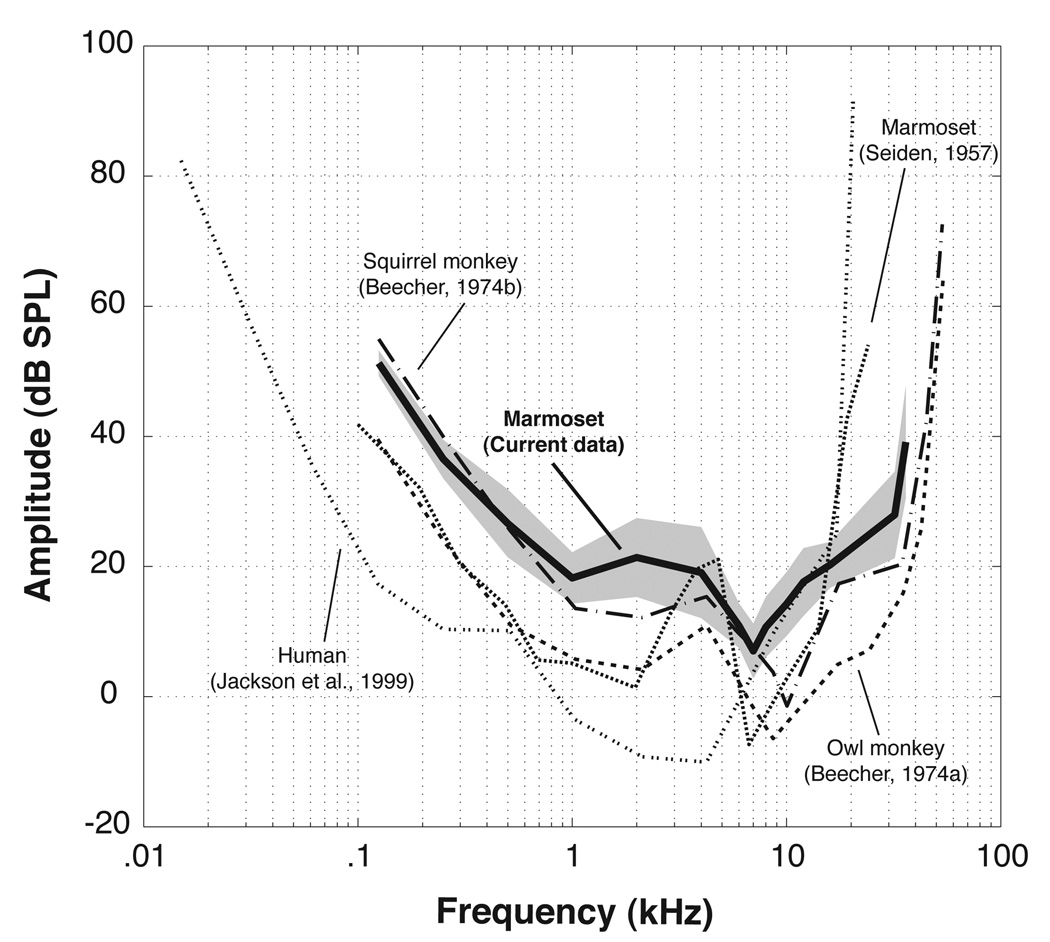
Figure 3.
Comparison of audiograms obtained from the current study (bold solid line, shaded area denotes one standard deviation from the mean) and several previous studies (common marmosets [Seiden, 1957], squirrel monkeys [Beecher, 1974b], owl monkeys [Beecher, 1974a], and humans [Jackson et al., 1999]).

