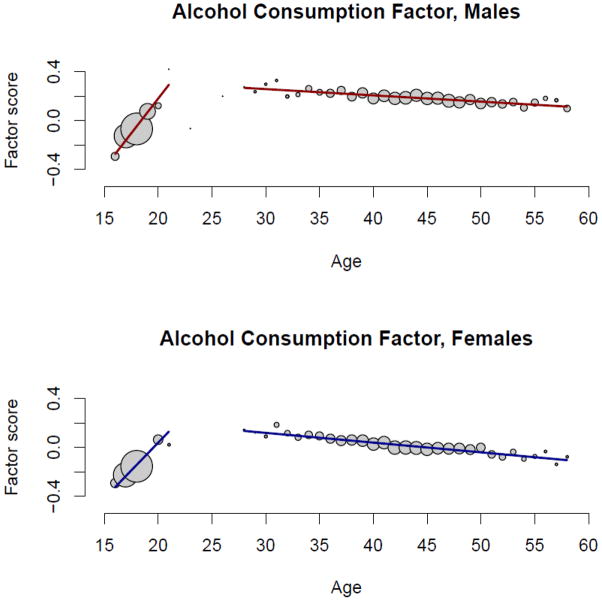
Figure 2.
Alcohol consumption factor scores plotted as a function of age, separately for male and female participants. The size of the circles is proportional to the number of participants with that age. For the purpose of visual presentation, the regression lines were fit using a piecewise linear regression fitting the data separately for the offspring (≤ 21 years) and parent (≥ 28 years) participants.

