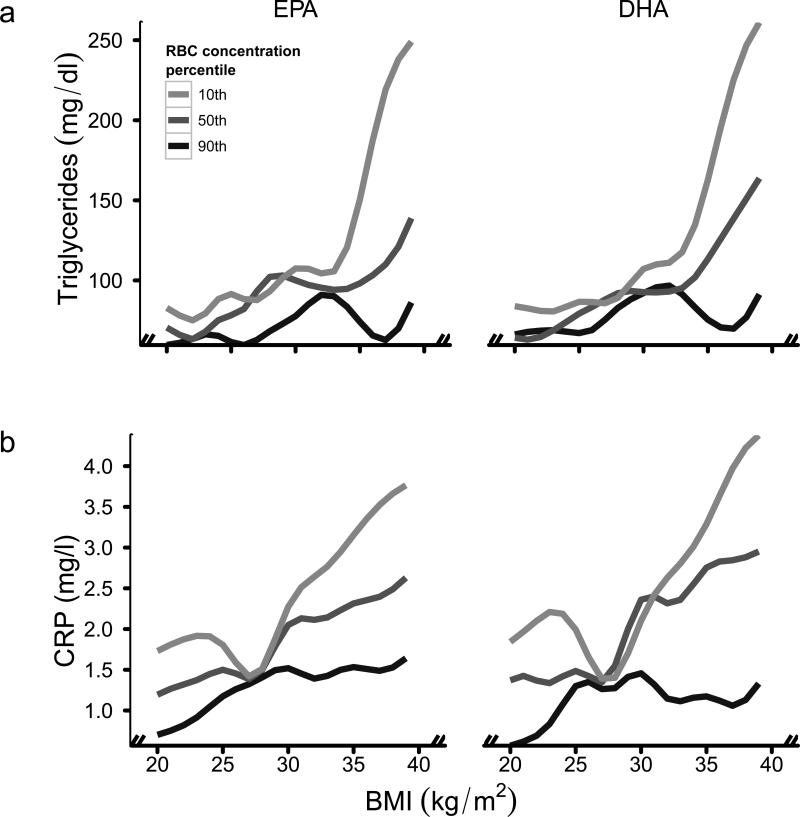
Figure 1.
Generalized Additive Models (GAM) of the associations of BMI with triglycerides (a) and CRP (b) by eicosapentaenoic acid (EPA) and docosahexaenoic acid (DHA), as percentages of total fatty acids in RBC. The GAM include a bivariate smooth surface over EPA or DHA and BMI (all continuous). The estimated GAM were evaluated at mean values of age, gender and current smoking status and at the 10th (light grey line), 50th (dark grey line) and 90th (black line) percentiles of RBC EPA (1%, 3% and 5% of total fatty acids) and DHA (4%, 7% and 9% of total fatty acids). To convert triglycerides from mg/dl to mmol/l, multiply by 0.0113.

