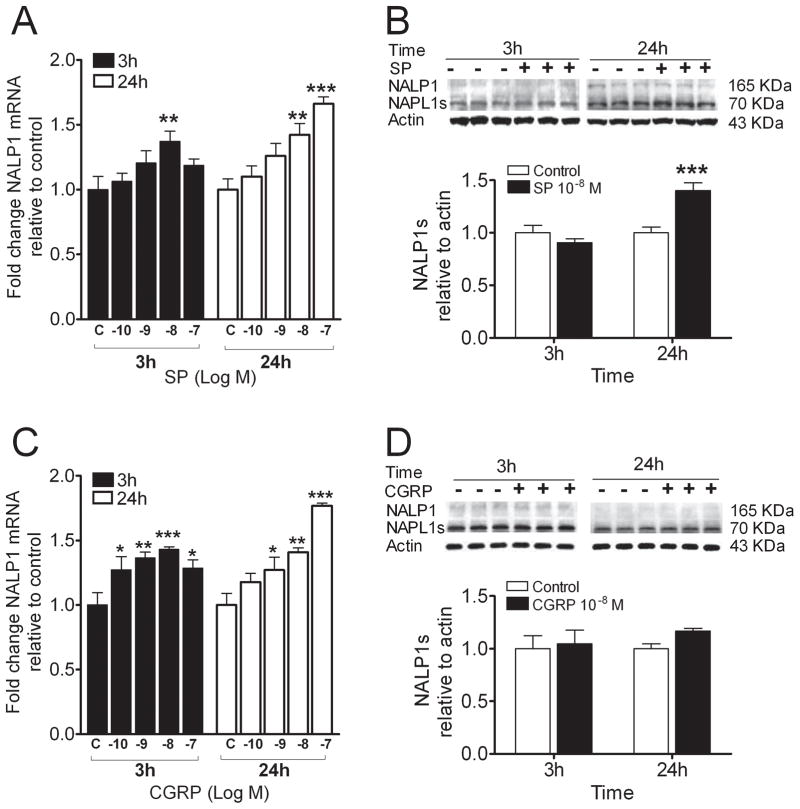
Figure 4.
Neuropeptides induced gene and protein expression of inflammasome component, NALP1 in the REK cultures. A) Substance P (SP) stimulated NAPL1 gene expression in a dose-dependent manner at 3 and 24 h posttreatment, respectively. B) Western blot band appearances (upper panel) and scanned densities presented as a bar graph (lower panel) for the full length NAPL1 and the short form NALP1 (NALP1s) in cultures treated with and without SP. C) calcitonin-gene related peptide (CGRP) dose-dependently stimulated NAPL1 gene expression at 3 and 24 h posttreatment, separately. D) Western blot band appearances (upper panel) and scanned densities presented as a bar graph (lower panel) for the full length NAPL1 and NALP1s in cultures treated with and without CGRP. Values are means ± SE. * p<0.05, ** p<0.01, *** p<0.001 vs. the vehicle-treated control cells (C).

