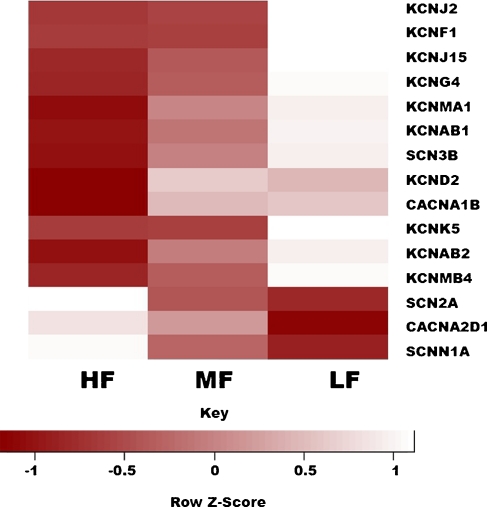
FIG. 3.
Many ion channels are expressed in a gradient along the tonotopic axis of the chicken basilar papilla. Shown is a heat map showing normalized expression levels in the high- (HF), middle- (MF), and low-frequency (LF) segments of the basilar papilla for 15 ion channel genes. The depicted expression values are all normalized relative to the average for each row (i.e., the average expression for a particular gene across all three segments). As shown in the color key, light rectangles represent higher expression levels than dark rectangles. Most of the genes shown appear to be expressed in a gradient along the tonotopic axis.

