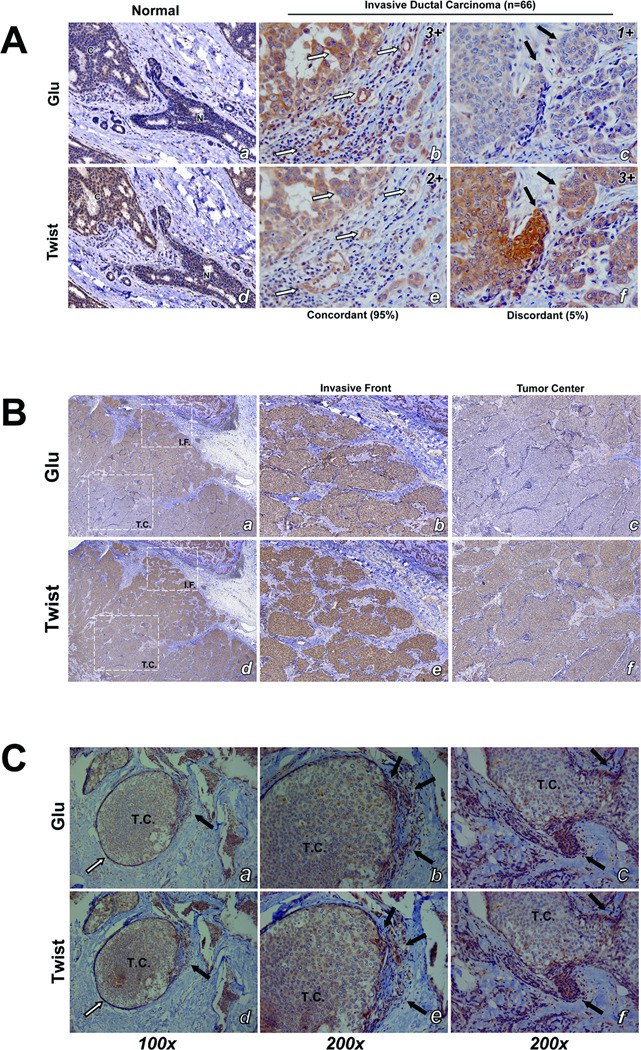
Figure 4. Immunohistochemical staining shows high concordance between Twist and Glu expression in patient tumor samples (33 patients; 66 samples).
A: Duplicate tissue microarrays stained for Glu and Twist were scored by intensity (negative, 0; weak, 1; moderate, 2; and strong, 3). Normal breast epithelial ducts (N) stain weakly for both Twist and Glu while the cancerous region (C) stains strongly (a,d). Patients with invasive ductal carcinoma exhibited high concordance (95%) between staining intensity and localization of Twist and Glu expression (b,e; white arrows). Discordance was observed in only 5% of patient samples (c,f; black arrows). Representative immunohistochemical scores are displayed in upper right corner. B: Low magnification shows an increase in staining intensity of Twist and Glu at the invasive front (IF) compared to the tumor center (TC) (a,b). Higher magnification shows stronger staining of Twist and Glu at the invasive front (b,e) while the tumor center stains weaker (c,f). C: Ductal carcinoma in situ (DCIS) samples (a,b) show weak expression of Twist and Glu in the tumor center enclosed by basement membrane (white arrows), but that both Twist and Glu are coordinately upregulated at sites of tumor invasion where the basement membrane is compromised (black arrows). Higher magnification image pairs (b,e and c,f) show Twist and Glu are upregulated in matching cells (black arrows).

