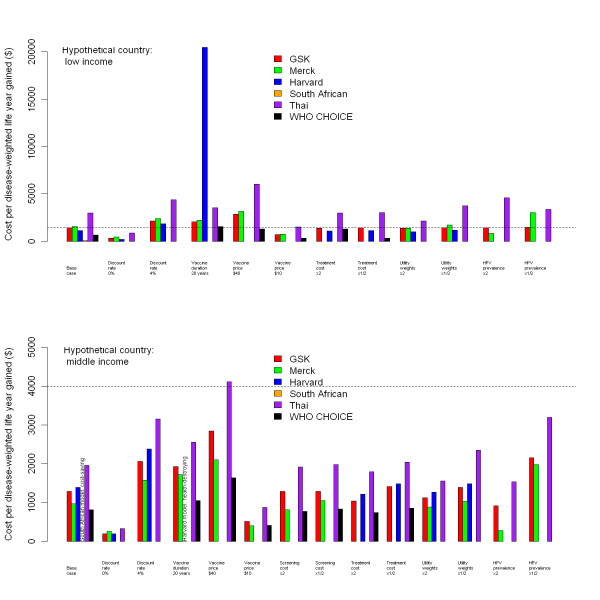
Figure 2.
Incremental cost-effectiveness ratios for vaccination from each model. Discounted incremental cost-effectiveness ratios for vaccination in the hypothetical low-income (top graph) and middle-income (bottom graph) countries, using each of the six models. Dotted lines show gross domestic product (GDP) per capita for the hypothetical country. Missing bars indicate that results were not available for that model.

