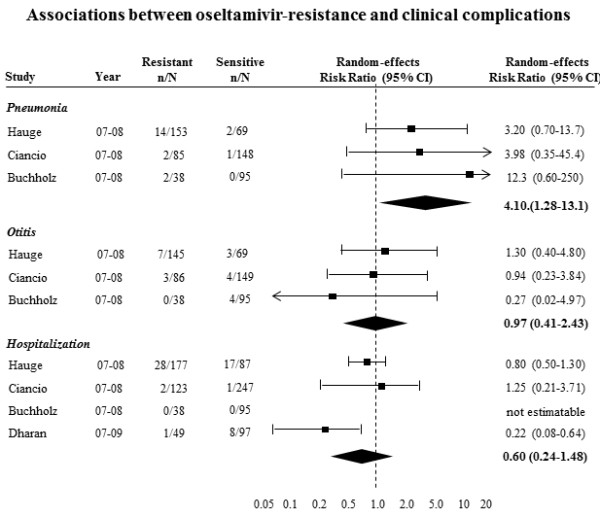
Figure 4.

Forest plots of risk ratios for associations between antiviral resistance and clinical complications. The risk ratios from the studies by Hauge and Ciancio are adjusted risk ratios obtained from multivariable models. The risk ratios from the Buchholz study are crude risk ratios based on zero-event continuity correction of 0.5. The Dharan risk ratio was transformed from an adjusted odds ratio based on a multivariable model.
