Figure 1.

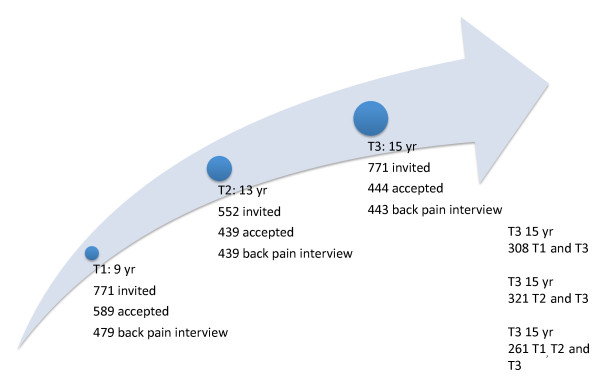
Flowchart. Flow of participants in a longitudinal study of Danish children/adolescents at three time points (T1, T2 and T3).

Flowchart. Flow of participants in a longitudinal study of Danish children/adolescents at three time points (T1, T2 and T3).