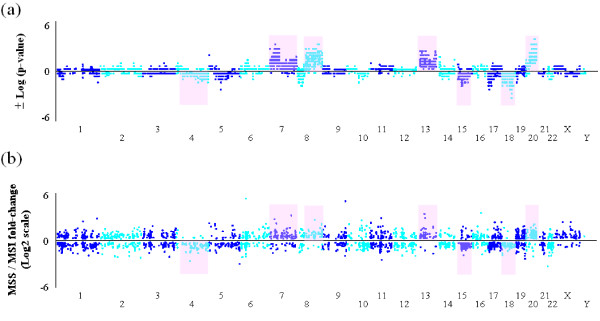
Figure 5.
Genomic profile comparisons between colorectal cancer (CRC) subtypes. (a). Gene-based copy number alteration (CNA) frequency difference between CRC subtypes. Each dot represents the significance of CNA frequency difference between MSS and MSI-H subtypes of each gene (Fisher's exact test). Top dots indicate the -log10 (p-value) of genes with CN gains, and bottom dots indicate the log10 (p-value) of genes with CN losses. (b). Comparison of gene expression differences between CRC subtypes. Each dot represents the log2 scale of average expression fold-change (MSS/MSI-H) of each gene (two sample t-test, p-value < 0.05).

