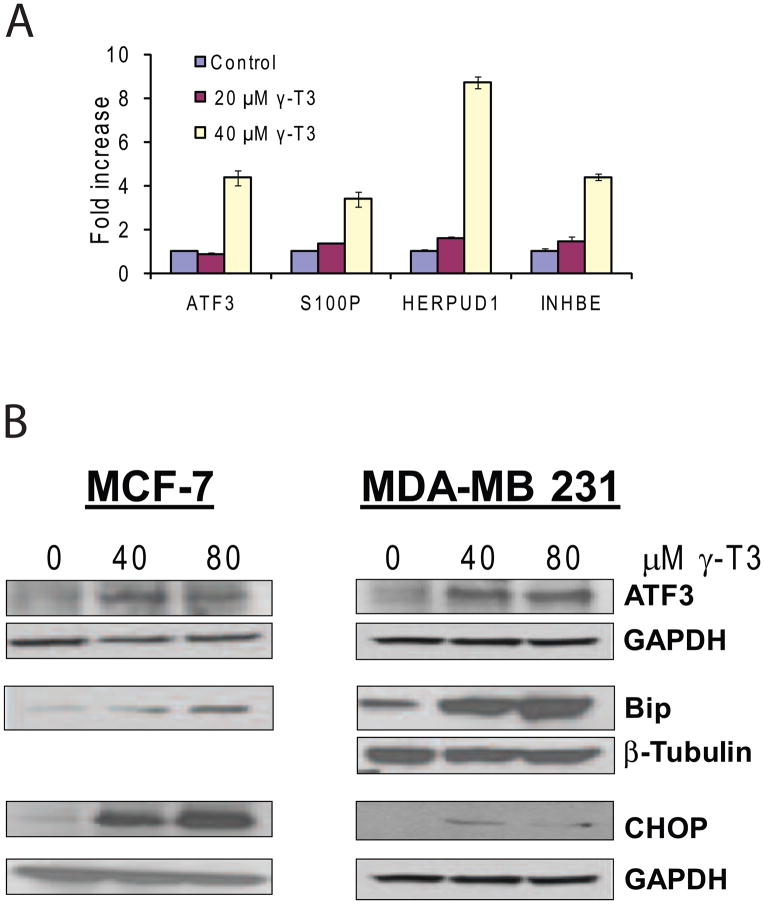
Fig. 4.
A. Validation of 4 differentially expressed genes by real-time RT-PCR in control and γ-T3 (20 and 40μM) treated MCF-7 cells. The transcript levels were normalized to GAPDH gene. The data is computed as ratio of indicated genes in γ-T3 treated cells relative to DMSO control treatments (representative of 3 experiments performed in triplicate (P<0.05, mean ± S.E.M. shown), B. Validation of ATF3, BiP and CHOP proteins in MCF-7 and MDA-MB 231 cells by Western blotting. MCF-7 cells: shown are ATF3 and its loading control; GAPDH loading control (lower panel) for Bip and CHOP. MDA-MB 231 cells: ATF3 blot and its loading control GAPDH. Bip and CHOP with their loading controls β-tubulin and GAPDH respectively.

