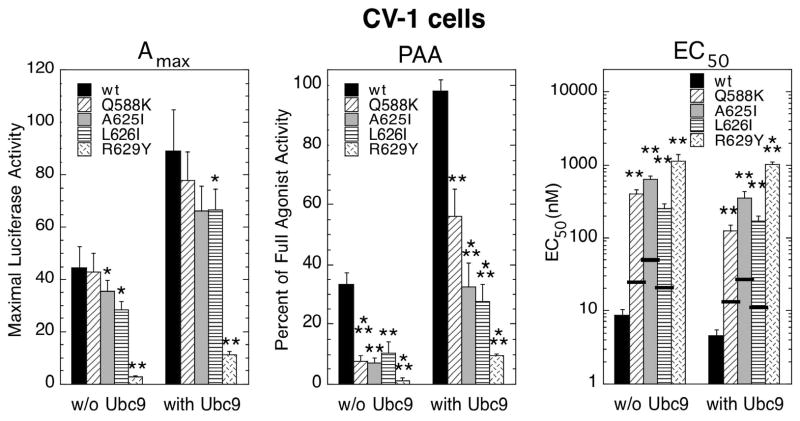
Fig. 3.
Variation in induction parameters of mutant GRs in CV-1 cells with increased Ubc9. Data from triplicate transiently transfected cells (1 ng GR ± 150 ng Ubc9 plasmid) were generated, analyzed, and plotted along with predicted EC50 values as in Fig. 1 (error bars = S.E.M. from 6–7 independent experiments). The absence of any measurable affinity of Dex for R629Y (9) precluded the calculation of a predicted EC50, so no thick horizontal bar is included. P-values for mutant vs. wild type GR under the same conditions are * < 0.05, ** < 0.005, and *** < 0.0005.

