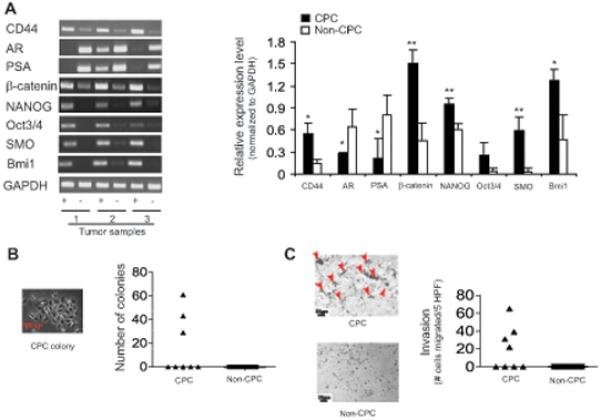
Figure 1. CPC phenotypes of cell subpopulations isolated from human prostate tumors.

(A) Left: Gene expression (by RT-PCR) of cell subpopulations from 3 individual tumors (“+” = CPC, and “−” = non-CPC). Right: Semi-quantitative densitometric analysis of gel at left (mean values from 3 tumors). (B) Relative colony formation and (C) matrigel invasion of cell subpopulations from 8 individual tumors with sample micrographs (arrows on matrigel micrograph indicate cells that migrated across the membrane).
