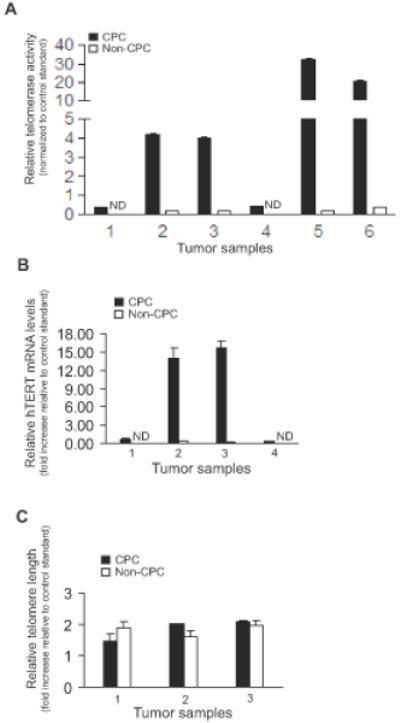
Figure 2. Telomerase and telomere characterization of CPC and non-CPC cell subpopulations isolated from human prostate tumors.

(A) Telomerase activity of cell subpopulations from 6 individual tumors by qPCR-TRAP, normalized to a standard control telomerase activity from DU145 cancer cells (p=0.03). (B) Relative hTERT mRNA levels of cell subpopulations in 4 individual tumors (p=0.008). (C) Telomere lengths of cell subpopulations in 3 individual tumors, respectively. In 2A-B, “ND” = not detectable. In all panels, 1000 cells were used for each experiment, and assays were conducted in triplicate and compared using a two-sided Wilcoxon matched-pairs signed rank test of statistical significance.
